| Home | Help | Search | Feedback | Contents |
![]()
| Copyright 1998 by the | Psychology in Spain, Vol 2 No 1, 43-47 |
| Colegio Oficial de Psicólogos |


This paper presents new research on the Type A behaviour scale ERCTA (Escala Retiro de Patrón de Conducta Tipo A),
developed with a Spanish population. The scale, with eight items, was applied to two groups: normal subjects, and subjects with cardiovascular disorders. We show the validity and reliability of the scale by means of: alpha coefficients, factor analysis and means differences, to demonstrate its internal consistency, construct validity and criterion-related validity. Factor analysis (principal components, varimax rotation) shows a structure of two factors. Factor 1 would be related with a positive work orientation, while Factor 2 may be related to work stress. Item 8 (emotional expression), which in other studies appeared isolated from this bifactorial structure, is now related to the second factor.En este artículo se presenta una nueva investigación con la escala de conducta Tipo A, ERCTA, desarrollada con una población espańola. Esta escala, de ocho ítems, se ha aplicado a sujetos normales y a pacientes con enfermedades cardíacas. Mostramos la validez y fiabilidad de la escala mediante los coeficientes alfa, análisis factorial, y significacion de diferencias de medias, para demostrar su consistencia interna, así como su validez de constructo y de criterio. El análisis factorial (componentes principales, rotación varimax) muestra una estructura de dos factores. El Factor 1 podría relacionarse con una orientación positiva hacia el trabajo, mientras que el Factor 2 puede estar relacionado con tensión o estrés laboral. El ítem 8 (expresión de las emociones), que en otros estudios apareció aislado de esta estructura bifactorial, aparece aquí relacionado con el segundo factor.
![]()
INTRODUCTION
METHOD
Subjects
The total sample comprises 476 subjects in two groups.
The first and most numerous (Group 1) consists of 316 incidental subjects, with a mean age of 23.5
years (S.D. = 4.58), due to the presence of a large number of students. The second group (Group 2) is made up of patients that were examined by the Cardiology Unit of the Gregorio Mara–on Hospital in Madrid by the two last-named authors of this
article (individual heteroapplication). The subjects in this group are 154 inor
out-patients suffering from well-documented coronary disorders or other cardiovascular
complaints. Their mean age is 57.9 (S.D. = 13.3). In terms of gender the sample is for the
most part feminine (300, as against 176 males), especially in Group 1, made up mostly of
students; in Group 2 the ratio was 117 men to 38 women.
Measures
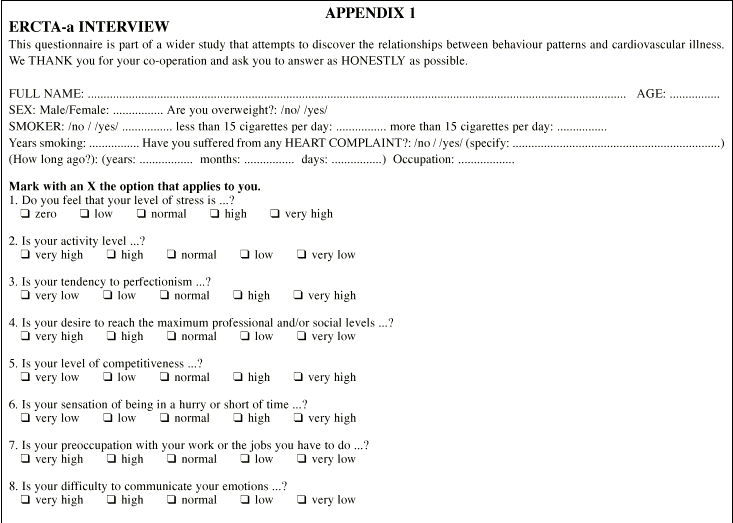
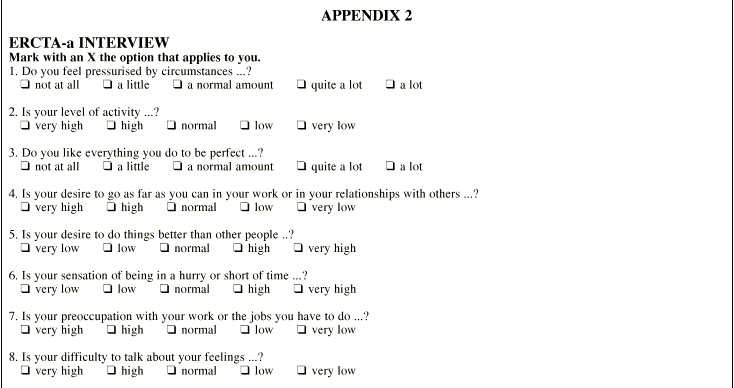
The measurement instrument used was the ERCTA-a, the "screening" instrument of
the TABP, designed by the first two authors of the research team. It comprises 8 items
with a 5-point response scale (see APPENDIX 1). The difficulty
observed on applying the first tests to the clinical sample with regard to the
understanding of the language used to formulate the questions led us to design a parallel
form, ERCTA-b (see APPENDIX 2), using simpler language. The
correlation between the two scales, obtained with 163 subjects from Group 1, is
sufficiently high (r = .880), with the two scales showing, for these subjects, similar
means and standard deviations, as it can be observed in Table
1. We also applied the Framingham Type A Scale (Haynes et al., 1978) to Group 1 subjects, in conjunction with the scales ERCTA-a (N=243) and
ERCTA-b (N=155). Subjects were also asked to respond to a brief questionnaire on general
health matters (smoking, weight, etc.), whose relationship to the scores in the scales
will be analysed in a later work.
RESULTS
Scores on the total scale
In a previous study (Rodríguez
Sutil, et al., 1994), the distribution of scores on the ERCTA scale for the
total sample -after eliminating Item 8, for which the theoretical score for each
individual may range from 7 to 35- was approximately normal, with a mean of 24.36 that
coincided with the median, 24.00, and a standard deviation of 3.81. If we consider, as in
other works (cf. Miller et al.,
1991) that the proportion of TABP in the population is around 50%, we could take a
score of 24 as orientative. In the current sample, the mean is slightly lower (22.94;
s.d.= 3.73), perhaps due to the high proportion of young people and women, with an
approximately normal distribution. As for the parallel form (ERCTA-b) the mean is 24.60
(S.D. 3.86), somewhat higher due to the abundance of clinical subjects.
Factorial analysis
The construct validity of the scales was established by means of an analysis of principal
components with varimax rotation, using the SPSS program FACTOR. With the ERCTA-a -applied
to 397 subjects- we obtained, in a first analysis, 2 factors, following Kaiser's criterion
of eigenvalues greater than 1. Overall, these explained 49.8% of total variance. Table 2 shows this factorial solution. In Factor 1,
items with relevant weight are numbers 2, 4 and 7, which we may consider as making up a
positive feature of work orientation (activity, professional goals, attention to work).
Factor 2, on the other hand, may represent a negative feature of work tension (stress,
perfectionism, competitiveness, hurry). Item 8, which in previous studies appeared to be
isolated, saturates positively in Factor 2 and negatively in Factor 1, a result that
appears to be coherent with the above descriptions. That is, subjects that experience
stress are those that also have greater difficulty in expressing their emotions.
The ERCTA-b scale -applied to 252 subjects- also gave us 2 factors, again following
Kaiser's criterion of eigenvalues greater than 1. Overall, these two factors could explain
48.9% of the total variance. Table 3 shows this
factorial solution.
As it can be observed, this second table repeats point
by point the factorial structure of the first one, thus giving additional support to the
previously proposed interpretation. According to these data, moreover, Item 8 appears to
be even more clearly associated with Factor 2.
The analyses of elements and the calculation of the alpha coefficient of
reliability-internal consistency were carried out using the SPSS program RELIABILITY. The
homogeneity scores of the elements attained high values for both scales. The alpha
coefficient, with Item 8 eliminated, reached a value of .6834, for ERCTA-a, and .7073, for
ERCTA-b, which are quite high values, if we consider that it is a short-length test. When
we combine the two scales -with 171 subjects- the alpha coefficient rises to .8389,
considering 14 items.
Correlations with the Framingham scale
In Table 4 it can be seen that the ERCTA scales
correlate in a moderate and significant way with one of the commonest TABP measurement
instruments, Framingham's Type A Behaviour Scale. It is noteworthy, nevertheless, that the
highest correlations occur for Factor 2. This seems to suggest that it is this factor, and
the items making it up, that best represents the characteristics of the TABP, so that this
pattern should be understood, above all, as a negative feature of self-induced work
stress.
Intergroup comparisons
Finally, in Table 5, we present the differences of
means between the two study groups. These differences, as indicated, are significant. They
are, in fact, sufficiently important for us to consider their utility for the clinical
field. We should, however, qualify this situation: according to the direct experience of
the last two authors with patients, these subjects may have been given ample information
by health staff about the possible causes of their illness, lifestyle, and how they should
change for the good of their future health. We still lack, therefore, the best form of
criteria validation, which would be the prediction of coronary disorders.
DISCUSSION AND CONCLUSIONS
The results of the factorial matrix suggest that there are two main variables relevant to
the TABP, which we have called: orientation
towards work and work tension or work stress. These two components are similar to those of
"competitive drive" and "impatience", which, according to Matthews (1982), are the only two
components associated with the subsequent appearance of coronary disorders, on the
Framingham scale, of a total of five factors. As it has been seen, the relationship with
this scale is especially obvious in Factor 2. This leads us to think that the TABP, as an
indicator of coronary risk, is impregnated chiefly by stress and hostile tendencies. Item
8, which in previous studies appeared isolated, saturates positively in Factor 2 and
negatively in Factor 1, suggesting that those subjects that experience stress, are
those that also have greater difficulty in expressing their emotions. Let us refer to two
studies coming from Scandinavian countries. In the most recent, carried out in Sweden by Orth-Gomer in 1994, it was found
that the relationship between TABP and coronary risk is only effective in those subjects
that lack appropriate social support. Finns Venalainen and Salonen (1992), meanwhile, from a psychodynamic
perspective, showed that Type A subjects usually have a more narcissistic, exploitative
and distant personality than other people. In view of this data, it does not seem
appropriate to eliminate Item 8, in spite of what other authors (cf. Del Pino et al., 1992) suggest, or we ourselves have suggested in earlier works.
One of the general conclusions we can draw is that, as several authors point out (Powell, 1987; Matthews, 1988, Miller et al., 1991, among others), it is necessary to separate the components of the TABP
in order to make a more precise prediction of the appearance of cardiovascular disorders
in the studied population.
Finally, we should emphasise the ample support the ERCTA scales (a and b) have received,
given their factorial structure, their correlation with other TABP measures and their
capacity for differentiating diagnostic groups.
REFERENCES
Amelang, M., Schmidt-Rathjens, C. and Matthews, G. (1966). Personality, cancer and
coronary heart disease: Further evidence on a controversial issue. British Journal of Health Psychology 1, 191-205.
Bortner, R. W. (1969). A short rating scale as a potential measure of pattern A behaviour.
Journal of Chronic Disease 22, 87-91.
Del Pino, A., Borges, A., Díaz, S., Suárez, D. and Rodríguez. I. (1990). Propiedades psicométricas de la escala Tipo A de
Framingham (ETAF) (Psychometric properties of
the Framingham Type A scale). Psiquis,
11, 19-30.
Del Pino Pérez, A., Gaos Meizoso, M. T., Díaz del Pino, S., Díaz Cruz, F. and Suárez
Santana, D. (1992).
Propiedades psicométricas de la escala de Bortner para la medida del patrón de conducta
Tipo "A" (Psychometric properties
of the Bortner scale for the measurement of the Type A behaviour pattern). Psiquis, 13, 11-26.
Eysenck, H. J. (1991). Personality, stress and disease: An interactionist perspective. Psychological Inquiry, 2, 221-232.
Flores, T., Valdés, M., Treserra, J., García-Esteve, LL. and Núńez, P. (1985). Cuestionario Bortner para la detección del
patrón A de conducta: validación espańola (Bortner
questionnaire for the detection of Type A behaviour pattern: Spanish validation). Revista del Departamento de Psiquiatría, 4, 227-238.
Foreyt, J. P. (1990). Behavioral Medicine. Review of Behaviour Therapy, 12, 138-177.
Friedman, M. and Rosenman, R. H. (1974). Type A Behaviour and your Heart.
New York: Knopf. García Fernández-Abascal, E. (1994). Intervención Comportamental en los Trastornos
Cardiovasculares (Behavioural Intervention in
Cardiovascular Disorders). Madrid: Fundación Universidad-Empresa.
Grossarth-Maticek, R. and Eysenck, H. J. (1990). Personality, stress and disease:
Description and validation of a new inventory. Psychological Reports, 66,
355-373.
Grossarth-Maticek, R., Eysenck, H. J. and Vetter, H. (1988). Personality type, smoking
habits and their interaction on predictors of cancer and coronary heart disease. Personality and Individual Differences, 9, 479-495.
Grupo de Estudio EPCUM (1993). Estudio
de Prevalencia y Prevención de las Enfermedades Cardiovasculares en Madrid (Study on the Prevalence and Prevention of Cardiovascular
Disorders in Madrid). Ayuntamiento de Madrid. Haynes,
S. G., Levine. S., Scotch. N., Feinleib, M. and Kannel, W. B. The relationship of
psychosocial factors to coronary heart disease in the Framingham study. I. Methods and
risk factors. American Journal of
Epidemiology, 107, 362-383.
Jenkins, C. D., Zyzanski, S. J. and Rosenman, R. H. (1979). The Jenkins Activity Survey for Health Prediction. New York: The Psychological Corporation.
Matthews, K. A. (1982). Psychological Perspectives on the Type A Behaviour Pattern. Psychological Bulletin, 91, 293-323
Matthews, K. A. (1988). Coronary heart disease and Type A behaviours: Update on and
alternative to the Booth-Kewley and Friedman quantitative review. Psychological Bulletin, 104, 373-380.
Miller, T. Q., Turner, Ch. W., Tindale, R. S., Posavac, E.J. and Dugoni, B.L. (1991).
Reasons for the trend toward null findings in research on Type A behaviour. Psychological Bulletin. 110, 469-485.
Orth-Gomer, K. (1994). Individual and environmental resources for health promotion:
Interactive effects. Advances, 10, 29-31. Powell, L. H. (1987). Issues in the Measurement of Type
A Behaviour Pattern. In S.V. Kasl and C.L. Cooper (comps.) Stress and Health: Issues in Research Methodology. New York: John Wiley & Sons.
Rodríguez Sutil, C., Gil-Corbacho, P. and Martínez Arias, R. (1996). Presentación de la Escala Retiro de Patrón de
Conducta Tipo A (ERCTA) (Presentation of the
ERCTA scale). Psicothema, 8, 1, 207-213.
Venalainen, E. and Salonen, J. T. (1992). Characteristics of Type-A men in a
psychodynamically oriented interview.
Nordic Journal of Psychiatry, 46, 329-334.
![]()
|
![]()
|
![]()
|
![]()
|
![]()
|
![]()
![]()
| Home | Help | Search | Feedback | Contents |
![]()